Implementation
Instrumenting
Prometheus
(Docs available here)
We will reuse the
/metrics
endpoint.
From what I understand, the new measured values will need to be added to Pushgateway. Then use/reuse the metrics definitions in the code -> how to. If needed, you can define your own collectors but the basic ones should be enough.
Gathering data and displaying them into graphs
The data will be gathered from the /metrics endpoint.
To aggregate the data dynamically in real time, we will use promql queries.
We have a few options here, each has some pros and cons which are described in each point.
Grafana
Probably the easiest way to go since grafana provides out-of-the-box support for prometheus. We have also some experience with duo prometheus && grafana, so it should be easier for someone whom run into a problem with this (he/she can ask someone (=^ ◡ ^=)).
Also since we already have a grafana dashboard listening on /metrics endpoint, it should be
fairly easy to visualize gathered data - just creating a new panel and navigate in the GUI
to edit panel and providing a reasonable
promql queries.
Pros:
- out-of-the-box support
- the easiest solution
- nice fancy dynamic graphs
- creating / deleting / editing graphs is easy and well described in the docs
- these graphs should be dynamic (when we want to see graphs in a given period - we can dynamically change this period)
Cons:
- visibility: only internal folks will be able to see the graphs (since our current dashboard is visible only for internal people and I don't expect that we will create another but public dashboard for everyone just so they can see it)
And it seems like there is no option how to make our grafana dashboard public. See this thread
But... :)
It seems like there is a way to share grafana dashboard (e.g. via packit.dev).
There are some projects that have made their dashboards public for a variety of uses. So we may decide to make our own grafana dashboard and we can share our metrics via (periodic) snapshots or provide a link.
But²
And it seems like there is another way to share and render even panels from internal dashboard and show to users only relevant graphs (no requirement for our own grafana dashboard).
It's also possible to share an individual panel so we can share individual panels via packit dashboard (if possible) and render them there. Also I didn't found a reason why we can't share our individual panels (to render it, packit dashboard should have access to our internal grafana dashboard - but it is possible, isn't it?) so it should be possible to share it on packit dashboard (and provide a link there in packit.dev menu) with our internal grafana.
To render these panels we must install the Grafana Image Renderer plugin
(These options below (dashboard and packit.dev) are pain in the ass - especially to safely gather and display the data from prometheus. I do not recommend to choose them since I spent quite some time to figure out how to do this but still a lot of implementation details are unknown to me)
Only dashboard
Way harder to implement since we have to aggregate and dynamically display the data into graphs by ourselves.
We can reuse the javascript code we have and just create a subpage (let's say dashboard.packit.dev/adoption-metrics), gather the data and then display these metrics. I probably got at least some answer to the question of how to export data and work with it in this article. However, we still won't be able to get and view some fancy charts.
Once we (somehow) gather the data - it should be easy to display them via charts.
Long story short: it will be easier just to implement the /graph endpoint which prometheus provides and view data there. But it has its limitations - it's not possible to view some advanced fancy graphs which grafana may provide.
Only packit.dev
The hardest option for implementation part (lot of evil javascript programming) since we have to
implement the javascript code from a scratch + the same things as described in the Dashboard
section above.
Pros:
- users can see the metric directly on our webpage
Cons:
- lot of extra work required
- lot of javascript coding ;)
Provide link to Grafana/Dashboard on packit.dev menu
It is also possible to implement the first(/second) option (grafana/dashboard) and provide a link to the page in packit.dev - so we will not reinvent the wheel, just provide a link via packit.dev menu and pretend like it is also available on packit.dev.
The menu on packit.dev page may look like this:
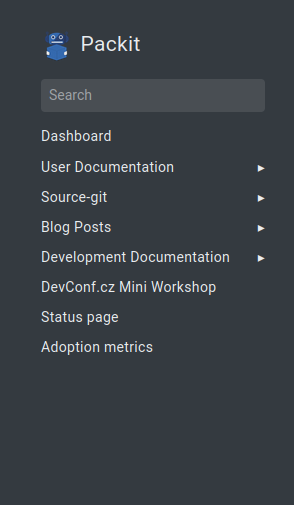
And user can click on the Adoption metrics option, and be redirected to the grafana/dashboard
with the real implementation.
Conclusion
Overall the simplest solution is the Grafana option. It will be quite challenging if we want to make our dashboard publicly visible but it's still easier than gathering the data and displaying them by ourselves (dashboard option).
The dashboard option requires gathering data and providing it as a graphs which will lead to more time required to complete the implementation. The advantage is that these graphs will be available to public out-of-the-box. However, as I provided above, it's really challenging to provide the data on our packit dashboard.
The hardest solution is implementing it on packit.dev page - which I do not recommend. We can implement the alternative (last) option instead and save some time.