What adoption metrics Packit team wants to measure
Static meaurement (updated periodically)
Newcomers adoption
Newcomers are newly approved namespaces.
- Total amount of newcomers in a given period (monthly/quarterly/half yearly/yearly).
Active namespaces
Active namespaces are those from whom we have recorded at least one activity in the past period (a given period of time month/quarter - can be specified via promql) and they do not fit into the category of newcomers.
Users retention
- Total amount of active namespaces.
- Percentage of previous newcomers who became active Packit users. ((amount of newcomers from previous period becoming an active namespaces / amount of newcomers from previous period) * 100)
- What percentage of all namespaces are active namespaces? (How many inactive namespaces do we have?)
Usage of Packit services
- Total number of work of individual services Packit has done in a given period (e.g. Packit has triggered X builds in the last month/quarter/year.)
- Percentage representation of individual services e.g. (COPR requests / all requests) * 100
The following metrics will be displayed as a histograms
As the metrics above - these will be updated once a given period.
- Show most 15/20 active project of ... COPR, TF, all downstream jobs (with links to their project as an inspiration)
It may look in very similar way how Packit team does its yearly evaluation. As an example I took a graph of Top 20 projects in the number of PR Copr Builds in 2021

Real time metrics
This is heavily inspired by COPR's real time stats
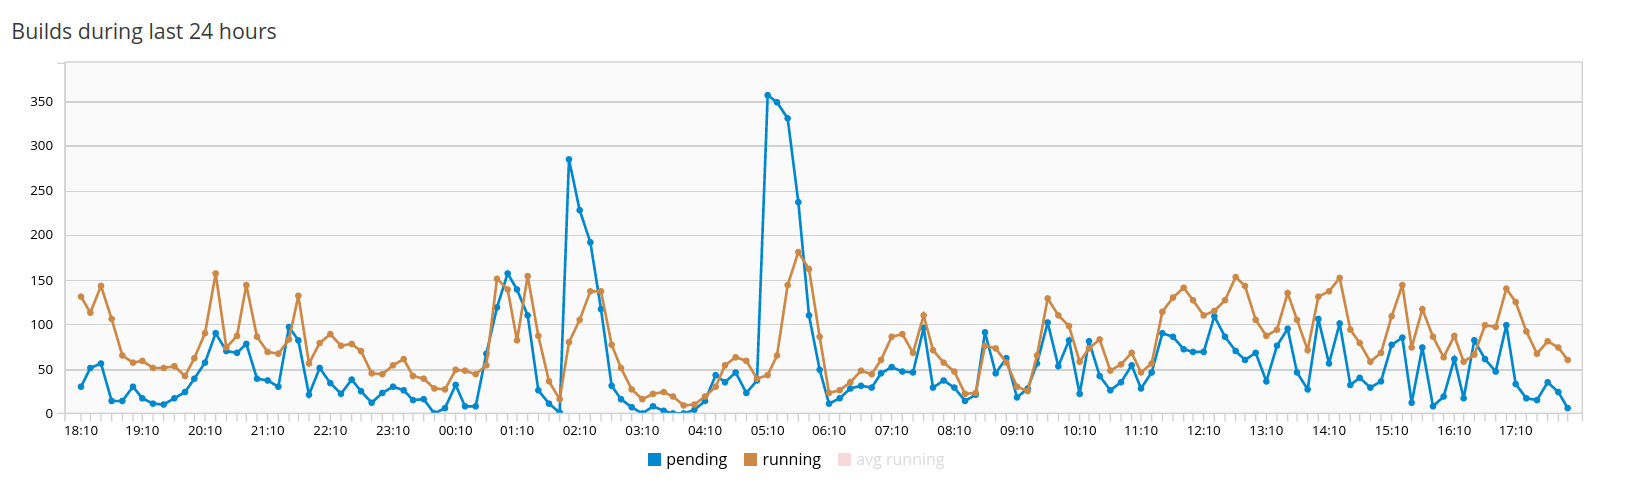
Real time graph will show overall activity of users in a given period (day/week/quarter)
- Make a graph for each service packit provides (COPR, TF, all downstream jobs) and display activity. This may help to see and identify peaks and lows in overall activity of users.
Example below shows how COPR does it and how it may look: